CHIP-8 in Common Lisp: Debugging Infrastructure
Posted on January 5th, 2017.
Our CHIP-8 emulator in Common Lisp is coming along nicely. It can play games, and in the last post we added a disassembler so we can dump the code of ROMs.
In this post we'll add some low-level debugging infrastructure so we can set breakpoints and step through code.
The full series of posts so far:
- CHIP-8 in Common Lisp: The CPU
- CHIP-8 in Common Lisp: Graphics
- CHIP-8 in Common Lisp: Input
- CHIP-8 in Common Lisp: Sound
- CHIP-8 in Common Lisp: Disassembly
- CHIP-8 in Common Lisp: Debugging Infrastructure
- CHIP-8 in Common Lisp: Menus
The full emulator source is on BitBucket and GitHub.
Architecture
The overall goal will be to keep the debugging infrastructure as separate from the rest of the emulation code as possible. Unfortunately the nature of debugging will require us to weave it into some of the normal emulator code, but we'll try to keep the pollution to a minimum.
All information about the state of the debugger (e.g. breakpoints, pause status,
etc) will be stored in a separate debugger data structure. We'll define a small
API for interacting with this structure. The chip struct will have
a debugger slot and will use the debugger API to interact with it. Later the
graphical debugger UI will also use this API.
The Debugger Data Structure
We'll start by creating a debugger struct and a with-debugger macro for it
and will add fields to this struct as we build the debugging infrastructure:
(defstruct debugger
  ; ...
  )

(define-with-macro debugger
  ; ...
  )
We'll then add a debugger slot to our chip struct:
(defstruct chip
  ; ...
  (debugger (make-debugger) :type debugger :read-only t))
It's read-only because we should never be swapping out a chip's debugger as it
runs.
Pausing
The first thing we'll add is support for pausing and unpausing execution. We'll
add a paused slot to the debugger:
(defstruct debugger
  (paused nil :type boolean))
Then we'll make some simple API functions so the emulator won't have to directly work with the debugger's slots:
(defun debugger-pause (debugger)
  (with-debugger (debugger)
    (setf paused t)))

(defun debugger-unpause (debugger)
  (with-debugger (debugger)
    (setf paused nil)))

(defun debugger-paused-p (debugger)
  (debugger-paused debugger))

(defun debugger-toggle-pause (debugger)
  (if (debugger-paused-p debugger)
    (debugger-unpause debugger)
    (debugger-pause debugger)))
Notice how debugger-toggle-pause uses the lower-level API functions instead of
directly modifying the slot. This will become important shortly.
Now we need to start modifying the emulator itself to pause execution when the debugger is paused. Unfortunately this is going to be pretty invasive, but I don't think there's much of a way around that.
We'll change emulate-cycle to check if the debugger is paused before actually
running an instruction:
(defun emulate-cycle (chip)
  (with-chip (chip)
    (if (debugger-paused-p debugger)      ; NEW
      (sleep 10/1000)                     ; NEW
      (let ((instruction (cat-bytes
                           (aref memory program-counter)
                           (aref memory (1+ program-counter)))))
        (zapf program-counter (chop 12 (+ % 2)))
        (dispatch-instruction chip instruction)))
    nil))
The timer thread will need to skip the timer decrements whenever the debugger is paused:
(defun run-timers (chip)
  (with-chip (chip)
    (iterate
      (while running)
      (when (not (debugger-paused-p debugger)) ; NEW
        (decrement-timers chip))
      (sleep 1/60))))
Next we'll modify the sound thread to be silent when paused, otherwise pausing during a buzz would result in perpetual buzzing:
(defun run-sound (chip)
  (portaudio:with-audio
    (portaudio:with-default-audio-stream
        (audio-stream 0 1
                      :sample-format :float
                      :sample-rate +sample-rate+
                      :frames-per-buffer +audio-buffer-size+)
      (with-chip (chip)
        (iterate (with buffer = (make-audio-buffer))
                 (with angle = 0.0)
                 (with rate = (audio-rate 440))
                 (while running)
                 (if (and (plusp sound-timer)
                          (not (debugger-paused-p debugger)))  ; NEW
                   (progn
                     (setf angle (funcall (audio-buffer-filler chip)
                                          buffer rate angle))
                     (portaudio:write-stream audio-stream buffer))
                   (sleep +audio-buffer-time+))))))
  nil)
We'll also need a way to actually pause and unpause the debugger. We could do it through NREPL or SLIME, but it'll be easier if we just add a key for it over on the Qt side of things:
(define-override (screen key-release-event) (ev)
  (let* ((key (q+:key ev))
         (pad-key (pad-key-for key))
         (debugger (chip8::chip-debugger chip))) ; NEW
    (if pad-key
      (chip8::keyup chip pad-key)
      (qtenumcase key
        ((q+:qt.key_escape) (die screen))
        ((q+:qt.key_f1)     (chip8::reset chip))
        ; NEW
        ((q+:qt.key_space)  (chip8::debugger-toggle-pause debugger)
        (t (pr :unknown-key (format nil "~X" key))))))
  (stop-overriding))
Now we can pause and unpause the emulator with the space bar, which is a handy feature to have all on its own.
Stepping
The next step is adding support for single-stepping through the code. We'll
start by adding a slot to the debugger:
(defstruct debugger
  ; ...
  (take-step nil :type boolean))
Then we'll add an API function to set it:
(defun debugger-step (debugger)
  (setf (debugger-take-step debugger) t))
Now we need to wire this into the emulator, which is a bit tricky. We need to handle the following cases:
- The debugger isn't paused at all, just run normally.
- The debugger is paused, but
take-stepis false, so just wait. - The debugger is paused and
take-stepis true, so take a single step and then pause after that.
We'll encapsulate this in a separate API function with a decidedly mediocre
name. debugger-check-wait will be run before each cycle, and will return t
whenever execution should wait. It will handle checking and updating
take-step as needed:
(defun debugger-check-wait (debugger)
  "Return `t` if the debugger wants execution to wait, `nil` otherwise."
  (with-debugger (debugger)
    (cond
      ;; If we're not paused, just run normally.
      ((not paused) nil)

      ;; If we're paused, but are ready to step, run just this once.
      (take-step (setf take-step nil)
                 nil)

      ;; Otherwise we're fully paused, so wait.
      (t t))))
I didn't name it with a -p suffix because although it qualifies as a predicate
according to the Common Lisp spec ("a function that returns a generalized
boolean as its first value") it has side effects, and I generally don't expect
predicates to modify state.
We can wire this into emulate-cycle, replacing the vanilla
debugger-paused-p:
(defun emulate-cycle (chip)
  (with-chip (chip)
    (if (debugger-check-wait debugger)      ; NEW
      (sleep 10/1000)
      (let ((instruction (cat-bytes
                           (aref memory program-counter)
                           (aref memory (1+ program-counter)))))
        (zapf program-counter (chop 12 (+ % 2)))
        (dispatch-instruction chip instruction)))
    nil))
Now pausing will work as before, but whenever we set take-step to t the CPU
will emulate one more cycle before going back to being paused. We can add a key
to the Qt screen to request a step:
(define-override (screen key-release-event) (ev)
  (let* ((key (q+:key ev))
         (pad-key (pad-key-for key))
         (debugger (chip8::chip-debugger chip)))
    (if pad-key
      (chip8::keyup chip pad-key)
      (qtenumcase key
        ((q+:qt.key_escape) (die screen))
        ((q+:qt.key_f1)     (chip8::reset chip))
        ; NEW
        ((q+:qt.key_f7)     (chip8::debugger-step debugger)
        ((q+:qt.key_space)  (chip8::debugger-toggle-pause debugger)
        (t (pr :unknown-key (format nil "~X" key))))))
  (stop-overriding))
Now we can walk through the code one instruction at a time by pausing the
emulator and hitting F7 to take a step. I picked F7 because it matches the
"take step" key for another emulator I use.
This is all great, but pretty useless unless we can also see what instruction is about to run.
Printing
Handling the printing is going to be ugly. We want to print the disassembly of the current instruction whenever we "arrive" at a new instruction. This will happen:
- When we first pause the debugger.
- After a single step has been taken.
We'll try to keep things as clean as possible on the emulator side of things by
containing all the ugliness in a debugger-arrive function, which we'll call at
the start of every possible cycle:
(defun emulate-cycle (chip)
  (with-chip (chip)
    (debugger-arrive debugger chip)                      ; NEW
    (if (debugger-check-wait debugger program-counter)
      (sleep 10/1000)
      (let ((instruction (cat-bytes
                           (aref memory program-counter)
                           (aref memory (1+ program-counter)))))
        (zapf program-counter (chop 12 (+ % 2)))
        (dispatch-instruction chip instruction)))
    nil))
Now we can handle the ugliness on the debugger side. We'll add a slot for tracking when we're waiting to arrive:
(defstruct debugger
  ; ...
  (awaiting-arrival nil :type boolean))
Then we'll update our API to set this flag properly:
(defun debugger-pause (debugger)
  (with-debugger (debugger)
    (setf paused t
          awaiting-arrival t)))  ; NEW

(defun debugger-unpause (debugger)
  (with-debugger (debugger)
    (setf paused nil
          awaiting-arrival nil)))  ; NEW

(defun debugger-check-wait (debugger)
  "Return `t` if the debugger wants execution to wait, `nil` otherwise."
  (with-debugger (debugger)
    (cond
      ;; If we're not paused, just run normally.
      ((not paused) nil)

      ;; If we're paused, but are ready to step, run just this once.
      (take-step (setf take-step nil
                       awaiting-arrival t)  ; NEW
                 nil)

      ;; Otherwise we're fully paused, so wait.
      (t t))))
We didn't have to touch debugger-toggle-pause because it uses the lower-level
API functions, so everything works properly.
Now we can implement debugger-arrive:
(defun debugger-arrive (debugger chip)
  (with-debugger (debugger)
    (when awaiting-arrival
      (setf awaiting-arrival nil)
      (debugger-print debugger chip))))
Finally we can implement the actual instruction-printing function, which is trivial thanks to the work we did in the previous post:
(defun debugger-print (debugger chip)
(declare (ignore debugger))
(print-disassembled-instruction (chip-memory chip)
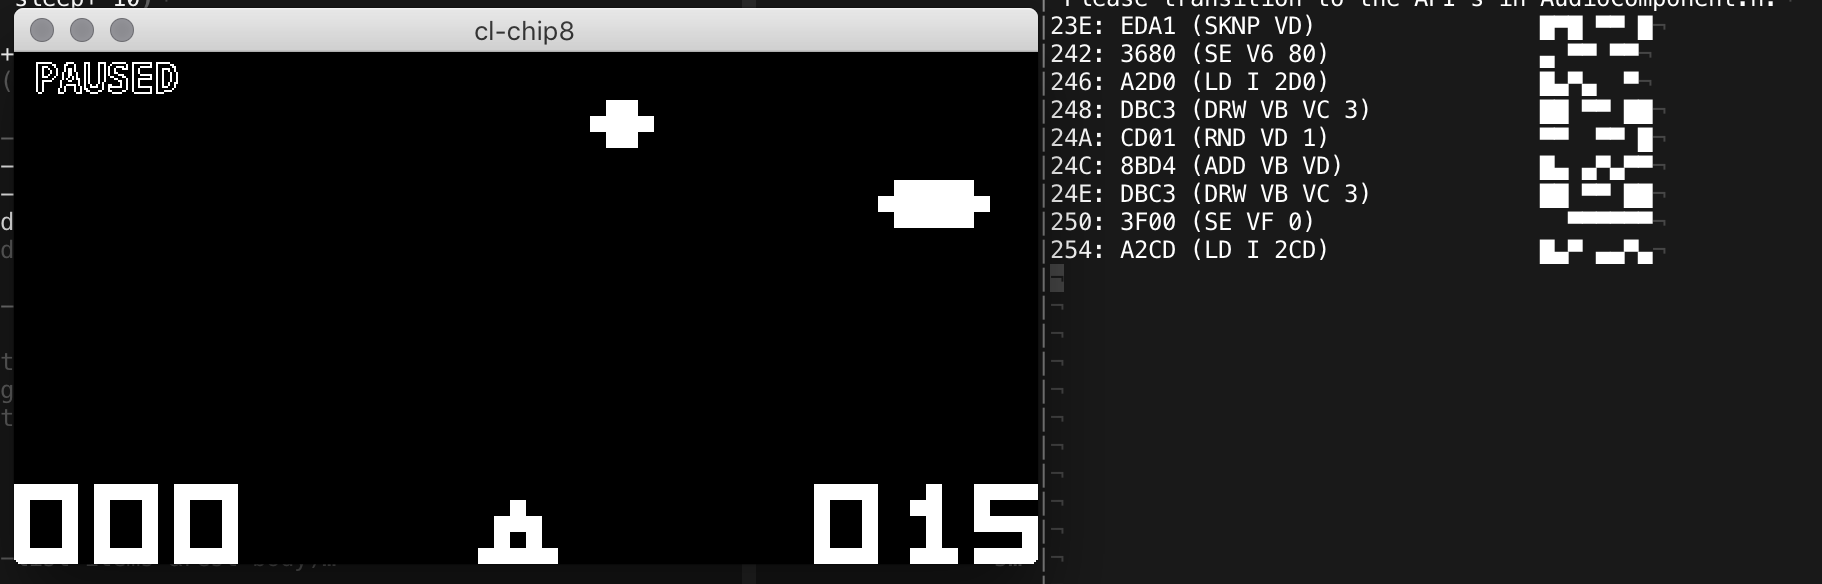
(chip-program-counter chip)))Now we can run the emulator, press space to pause and we'll see the current
instruction (the one about to be executed) dumped to the console. We can press
F7 to step one instruction at a time and they'll each be dumped in turn:
Breakpoints
Now that we can pause and step we can start tracking down bugs in the emulator. We'll want to add breakpoints so that we don't need to manually step until we get to a problematic instruction.
We'll start by adding a slot to store the breakpoint addresses, as well as API functions for adding and removing them:
(defstruct debugger
  ; ...
  (breakpoints nil :type list))

(defun debugger-add-breakpoint (debugger address)
  (pushnew address (debugger-breakpoints debugger)))

(defun debugger-remove-breakpoint (debugger address)
  (removef (debugger-breakpoints debugger) address))
removef is from Alexandria and is just a modify-macro for remove.
Next we'll create a debugger-check-breakpoints function that will check
whether we're at a breakpoint, and pause the debugger if so. It will return t
if we're at a breakpoint:
(defun debugger-check-breakpoints (debugger address)
  "Return `t` if the debugger is at a breakpoint, `nil` otherwise."
  (if (member address (debugger-breakpoints debugger))
    (progn (debugger-pause debugger)
           t)
    nil))
Note that we use the debugger-pause API function here to make sure we handle
setting the paused and awaiting-arrival slots properly. Now we can modify
debugger-check-wait to use this function. We'll also need to update it to
take the current instruction's address:
                                     ; NEW
(defun debugger-check-wait (debugger address)
  "Return `t` if the debugger wants execution to wait, `nil` otherwise."
  (with-debugger (debugger)
    (cond
      ;; If we're not paused, we might be at a breakpoint. ; NEW
      ((not paused) (debugger-check-breakpoints debugger   ; NEW
                                                address))  ; NEW

      ;; If we're paused, but are ready to step, run just this once.
      (take-step (setf take-step nil
                       awaiting-arrival t)
                 nil)

      ;; Otherwise we're fully paused, so wait.
      (t t))))
And that's it, nothing else needs to change. We can add breakpoints to the
currently running chip in the REPL with something like
(debugger-add-breakpoint (chip-debugger *c*) #x200). This isn't the nicest
interface, but it'll do the job for now.
Result
We've implemented basic pausing, single-stepping, and breakpoints. There are a lot more features we could add to the debugger, and we'll cover some in later posts.
Creating a debugging interface isn't the most glamorous work, but it pays for itself the first time you run into a bug in the emulator.
I'm not entirely happy with all the coupling between the emulator and the debugger, but I'm not sure it's possible to completely untangle the two. If you've got suggestions for how to design the interface more cleanly please let me know.
Future
We're nearing the end of this series, but there are a couple more things I'll cover before it's over:
- A graphical interface to the debugger and disassembler.
- Polishing up the interface a bit with menus for loading ROMs, configuring options, etc.